User Guide - Visualizer

Last updated November 8, 2023

Visualizer

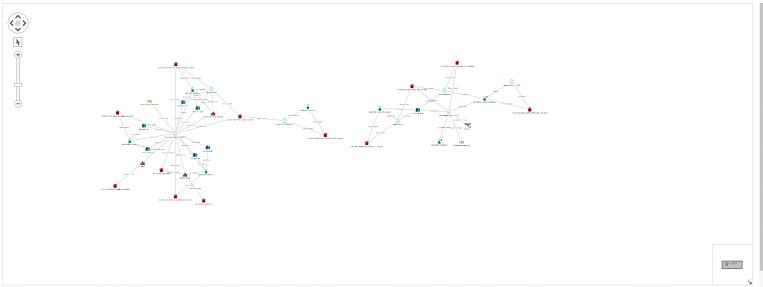
Visualizer graphically presents associative query results among people, places, and things that exist in both CrimeTracer and Thomson Reuters CLEAR. These associations might not be obvious when viewed textually. Visualizer is useful in complex investigations that involve multiple suspects. The more linkages among objects, the closer they appear to entities of interest. Queries can also be refined to allow you to focus on specific entities within a specific time period that you define.
Starting Visualizer
  1. Run an Associations search.
  2. Click Visualize. If matches are found, the Visualizer is displayed.
Document Quick View

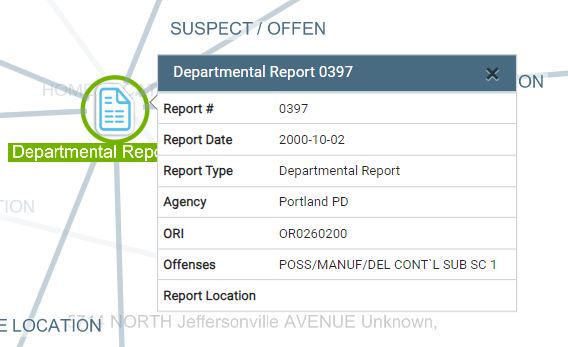
When you visualize an entity you will see an orange note icon near the document as shown below:

Quick View Icon

Click on that orange note to be presented with a quick summary of that document. To close the summary, use the 'X' in the top right.

Document Quick View
Time Bar

Displayed at the bottom of the visualizer you will find the timeline as shown below:

Time Bar

From here you can:

  1. Double click a specific bar to filter to just that date
  2. Slide the sides to only show a date range
  3. Click on Play to show how entities appear on the chart over time

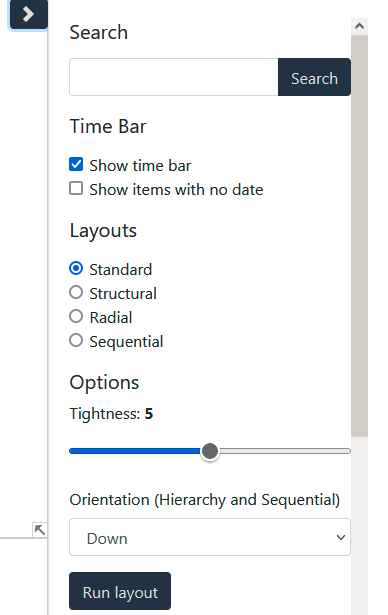
The Time Bar is currently off by default. To turn it on, check the checkbox in the slide out panel on the right of the visualizer. Note that not all entities may be associated to dates and there is an option here to show items with no date.

Time Bar Options
Showing and Hiding Entities

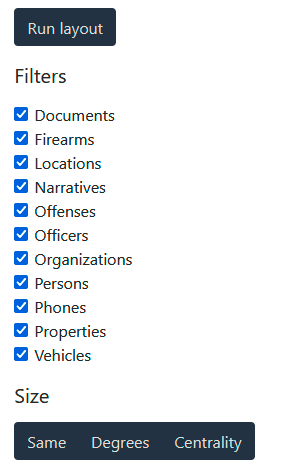
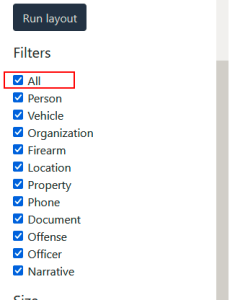
On the slide out panel located to the right of the visualizer, select and de-select what items appear on the visualizer. Note that the items unchecked will still be visible, but dimmed to allow the user to follow links if desired.

Showing and Hiding Entities Options

The size option at the bottom will change the size of entities:

  • Same - All the entities are the same
  • Degrees - The more links from an entity the larger it will display
  • Centrality - This takes into account the number of links each node has and the number of links their connections have
Indication of starting entity or entities

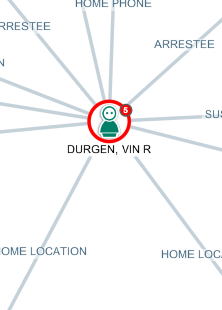
A visual indication is given on your starting entity or entities. A red circle will appear around them.

Red circle on starting entity

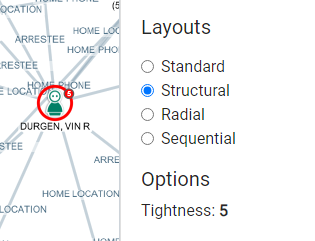
Changing the layout will keep this entity highlighted as well.

Red circle on starting entity layout

C

Select all entities in Visualizer

A quick way to select all the entities or turn off all the entities, allowing you to add them back one at a time

Red circle on starting entity

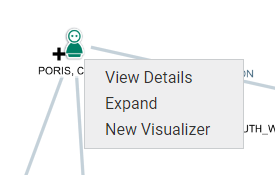
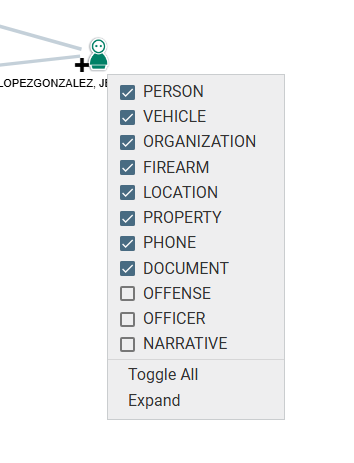
Right click an entity in Visualizer

When you right click on an entity, you have the option to view the Details Page for the entity, expand associations to the entity, or open a new tab and display a new visualizer chart based on the selected entity.

Right click options

Example Tutorial

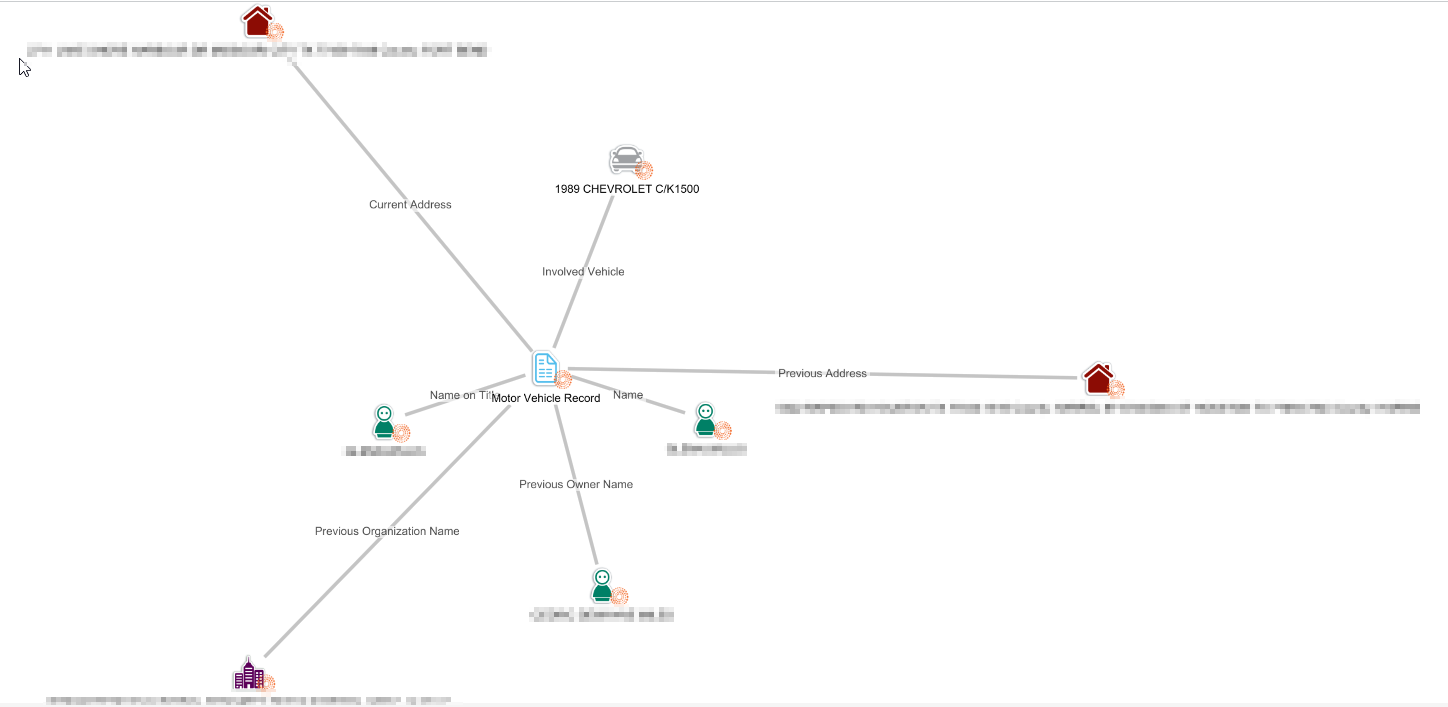
This example explores links between people, locations, and vehicles that exist in both CrimeTracer and Thomson Reuters CLEAR. We can see how a user can start with a simple motor vehicle record search and easily discover criminal activity involving that vehicle.

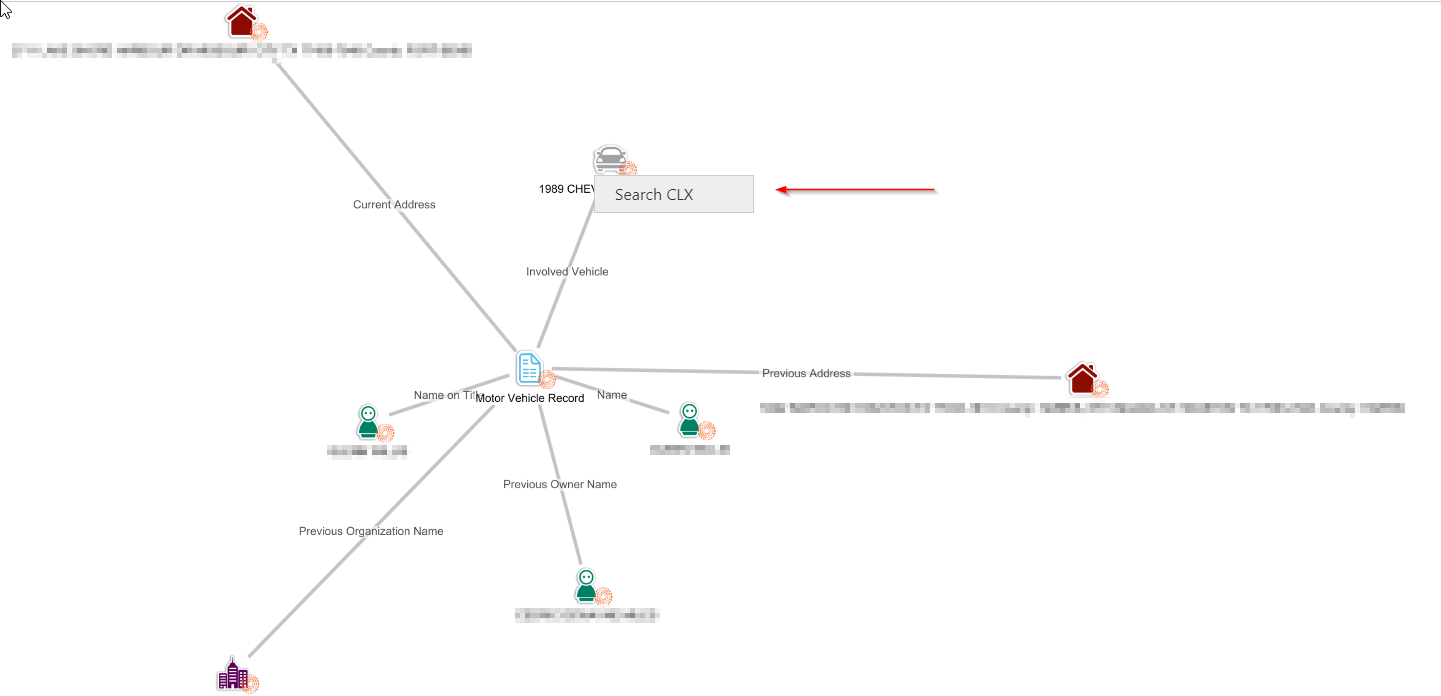
  1. Perform a CLEAR search and "Visualize" a CLEAR record.
  2. Visualizer Tutorial Step One
  3. Right Click on a person, vehicle, or location to show the "Search CLX" option. This option is available when there is enough information to conduct a meaningful search that may reveal a possible connection.
  4. Visualizer Tutorial Step Two
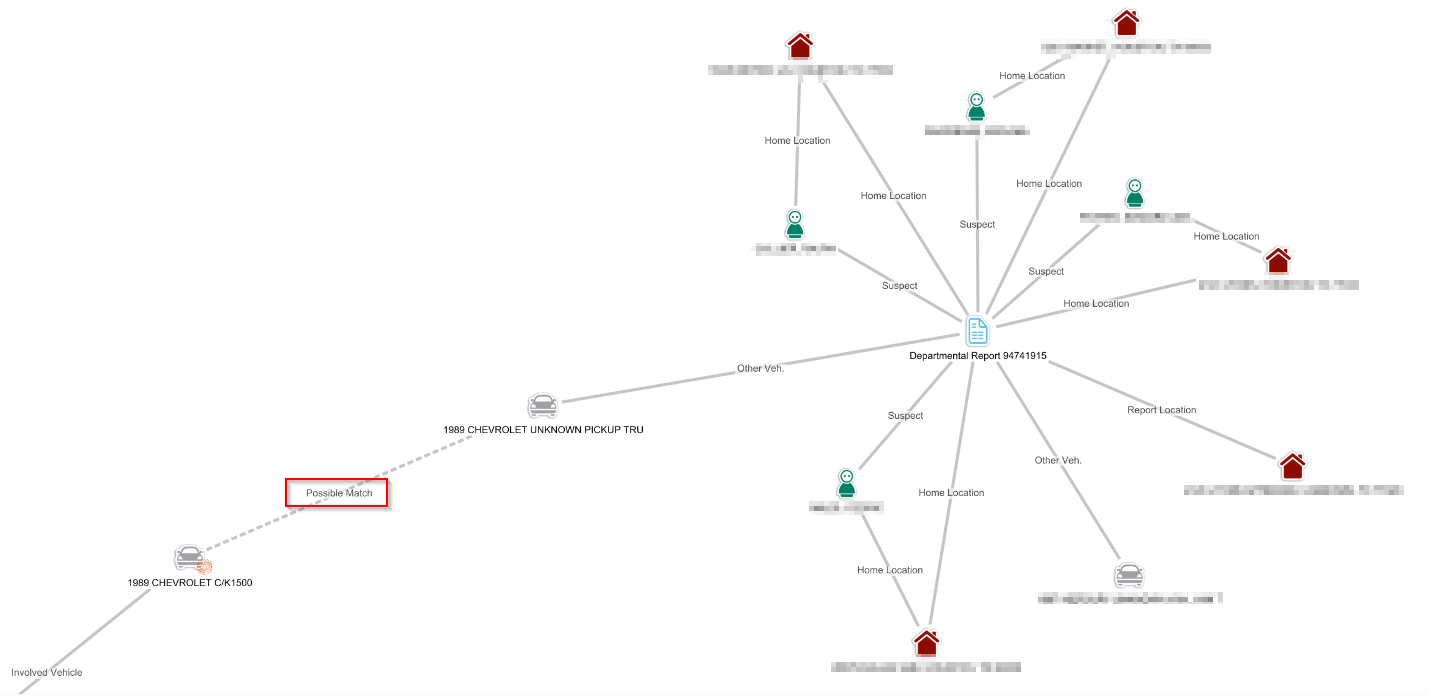
  5. CrimeTracer will display all possible matches to that entity. Possible Matches are visually distinguished from document co-occurrence matches by a dotted line.
  6. Visualizer Tutorial Step Three